~/project/sifter.md
Sifter
Canadian and US stocks, in plain English
- Timeline
- August - October 2026
- Type
- Side-Project
## overview
Sifter explains how your stocks are doing in plain English. It looks at the stocks you own or follow, tells you what changed and why, and skips the finance jargon.
## why-i-built-it
Why I built it
I used to swing trade a lot. As a student, though, I didn't have time to dig into a company's financials and figure out what they meant. I just wanted a quick recap of how my stocks were doing.
A lot of people my age are in the same spot. They buy a couple of index funds and a few companies they've heard of, then see red and green numbers every morning that they don't really understand. Free tools give you a chart and leave you to figure it out. The ones that explain things cost $25 to $120 a month, and a lot of them don't cover Canadian stocks well.
I built Sifter to lower the barrier for new investors.
## the-first-two-versions
The first two versions
The first version was a scanner for crypto and stocks, mostly memecoins. When I looked into it more, that space was already full of funded teams with faster data and one-click trading. I didn't think I could win there, so I dropped crypto completely.
The second version was a free tool for swing trading. Seven indicators would vote on each stock, the votes became a score, and the score became a trade plan with an entry, a stop, and a target. Every call would get checked 5, 10, and 20 days later so the app had a public track record.
## using-it-like-a-real-user
Using it like a real user
Before launching, I used Sifter the way my target user would: a student with no finance background, checking stocks on their phone between classes. But I didn't like it.
- The landing page asked me to sign in before showing a single stock.
- The dashboard was overwhelming. It was cluttered with numbers and terms I didn't truly understand.
- I had too many features. Paper trading, a MCP, a track record, etc. I didn't end up using any of these, and it overcomplicated the product.
- The BUY, SELL, and HOLD labels sounded more certain than the data behind them. To a beginner, BUY reads like a sure thing, even when the indicators only lean one way.
## revamping-the-product
Revamping the product
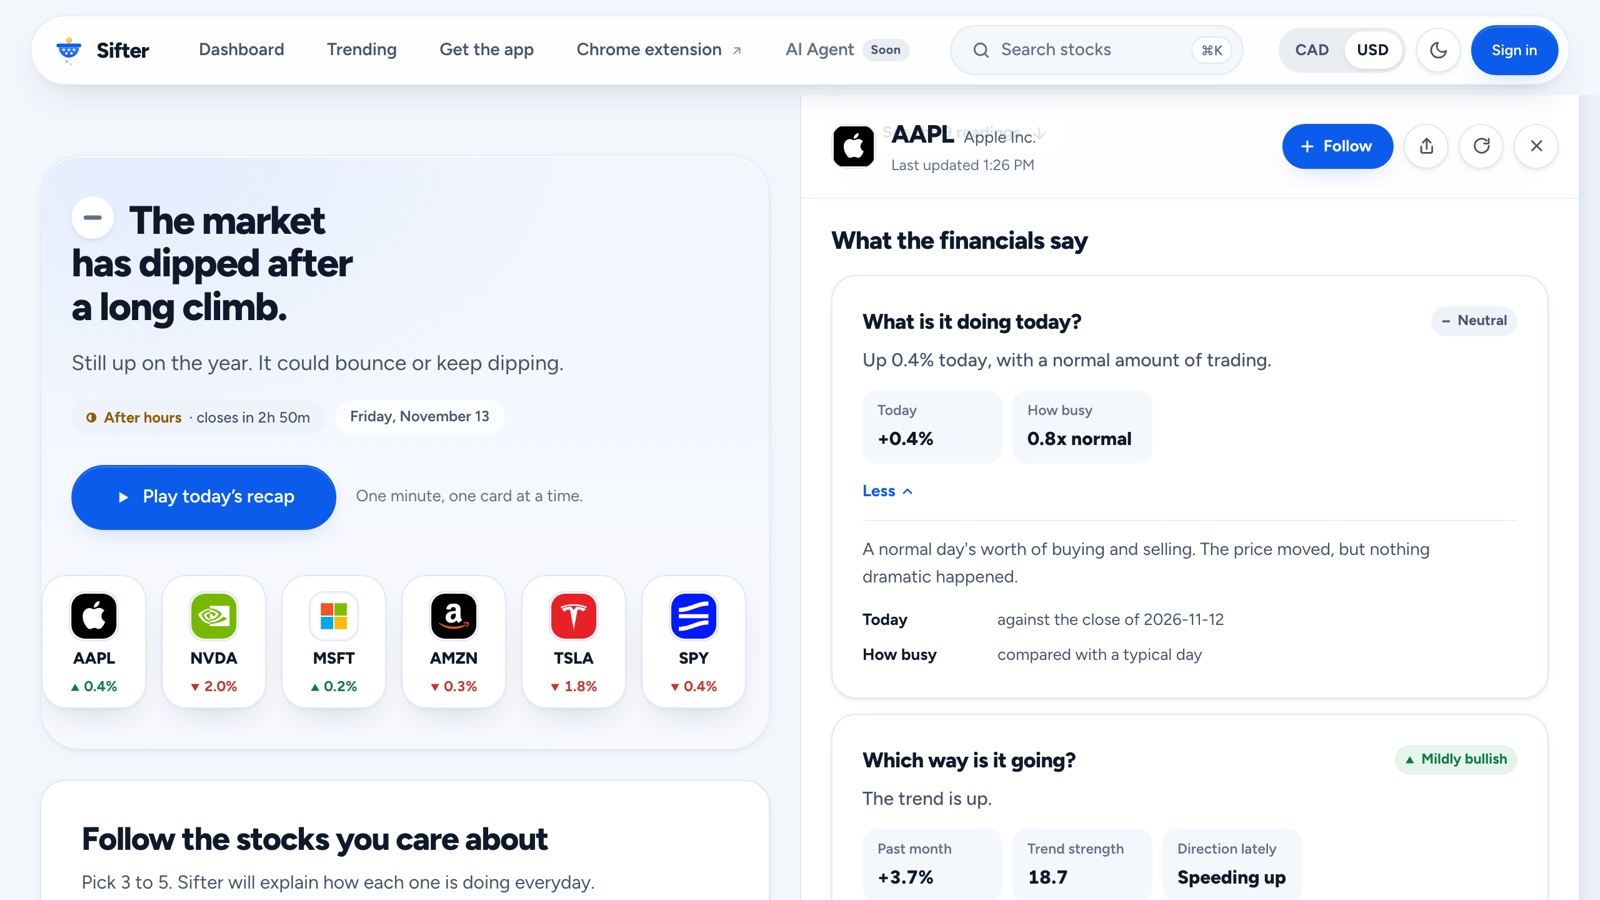
At the end of September, I completely revamped the product. Removed the track record and the paper trading. The dashboard is now a simple recap of what changed in the stocks you follow, and every number is explained in plain English. The BUY, SELL, and HOLD labels are gone, replaced with a neutral "what it means" explanation.
## two-features-i-built-then-paused
Two features I built, then paused
I added brokerage syncing with the SnapTrade API, so you could connect your brokerage and have your holdings show up on their own instead of typing them in. It worked, but I paused it in October for two reasons. SnapTrade charges per connected user, and Sifter is free and makes no money, so the cost would grow with every new user. It also asked too much too early. Connecting your brokerage to an app you just found looks sketchy, and I wouldn't do it either. Now you just tap the stocks you own, with no account and no share counts. Anyone who already linked a brokerage still has it working.
I also built a morning recap email, sent through Resend. I paused that too. A daily email from a new app can easily feel like spam, and in Canada and the US, every marketing email has to include a mailing address. Sifter isn't incorporated, so I don't have a business address I can publish. The code is still there, and I can turn both features back on with a switch once those problems are solved.
## onboarding
Onboarding
I thought a lot about the first minute someone spends on Sifter. The first version opened on a full-screen "Connect Brokerage" page you had to get past before you could see anything. Most people would leave right there.
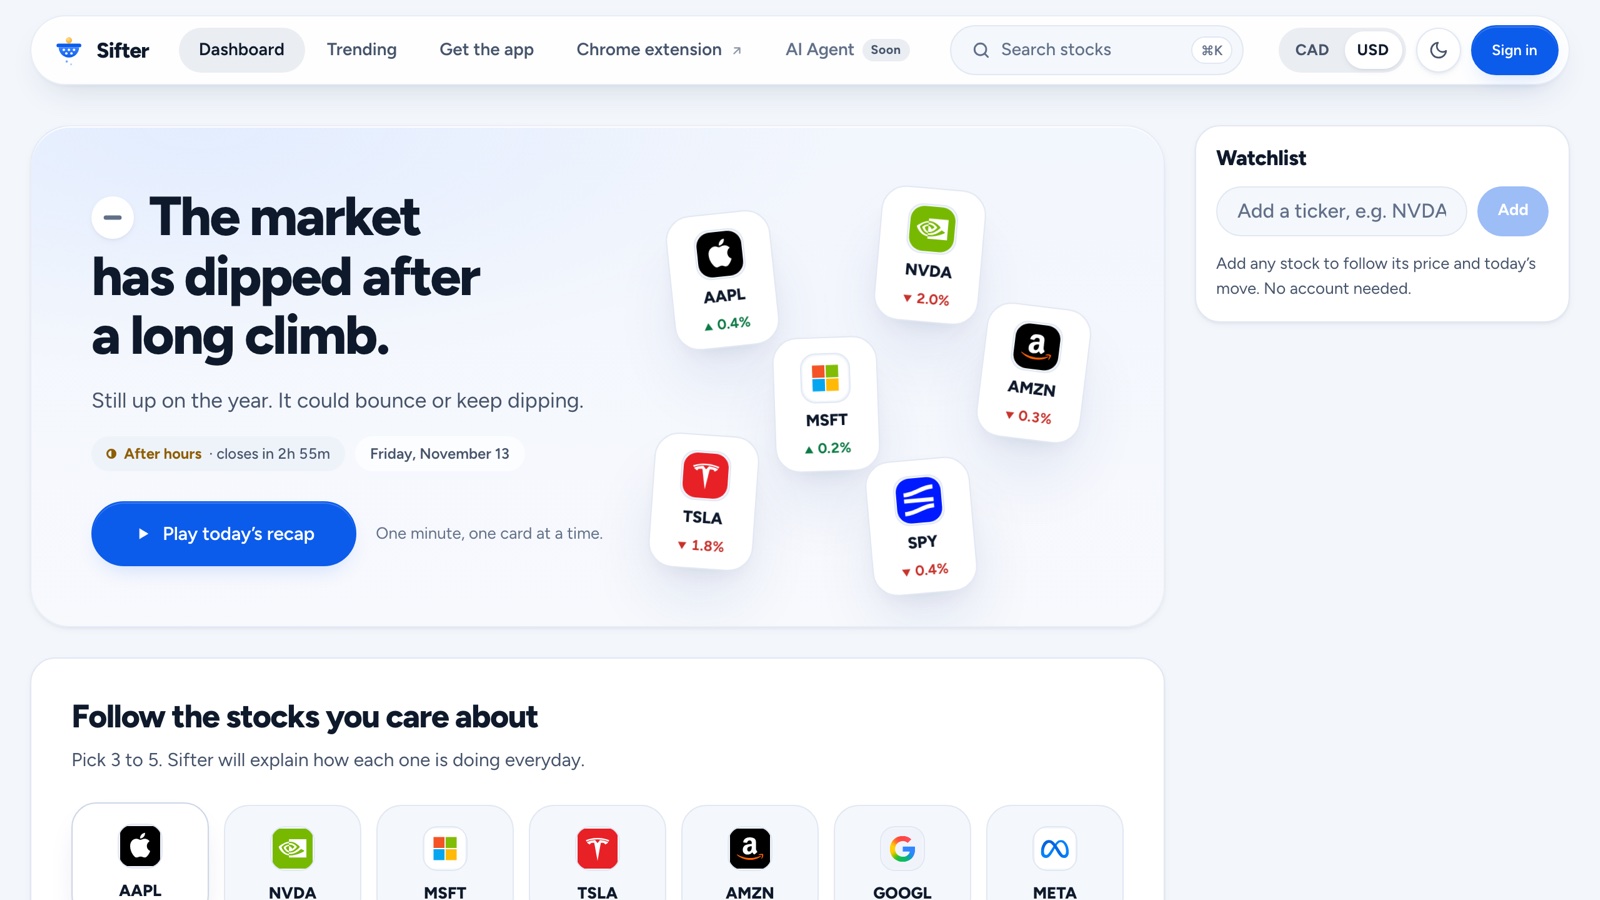
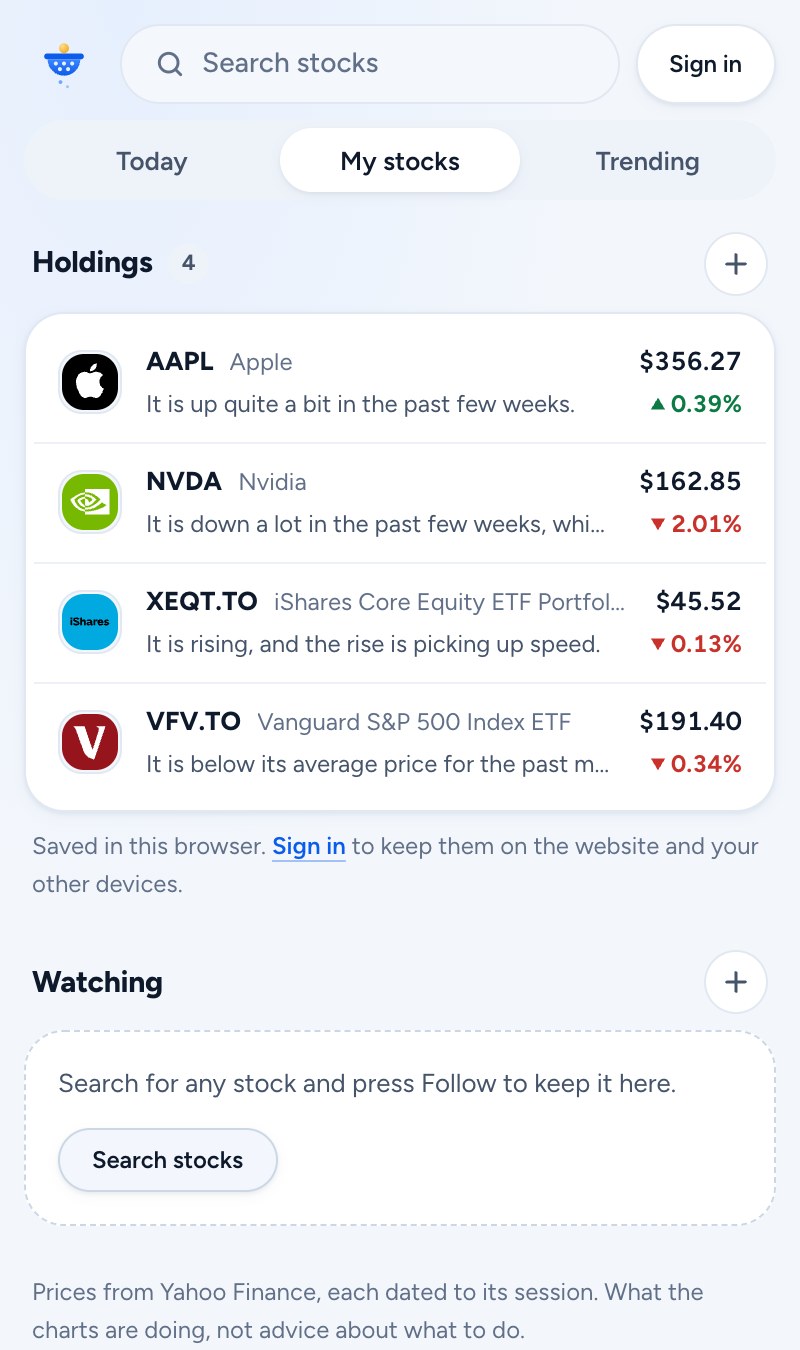
Now the dashboard is the first thing you see, with the market already on it. Instead of asking you to sign up, it asks you to tap 3 to 5 stocks you own or care about. Each tap adds the stock to your watchlist right away and saves it in your browser, so you're reading about your own stocks within seconds, without an account.
You only need an account when you want more. If you try to follow a sixth stock, Sifter asks you to sign in, and everything you already picked moves over to your account. By then you've already seen what the app does, so signing up feels like a fair trade instead of a wall.
## making-it-quick-to-read
Making it quick to read
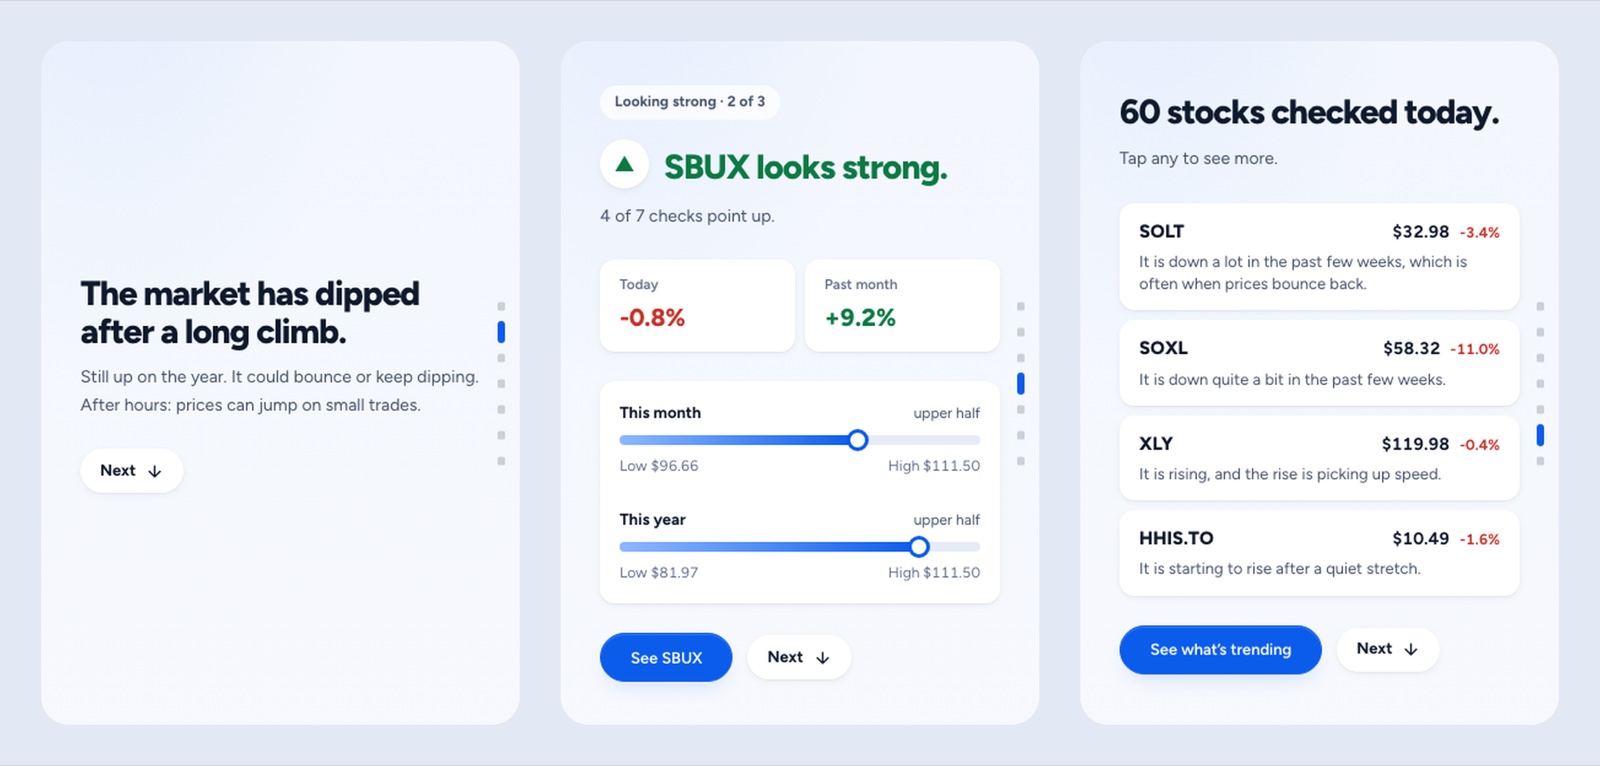
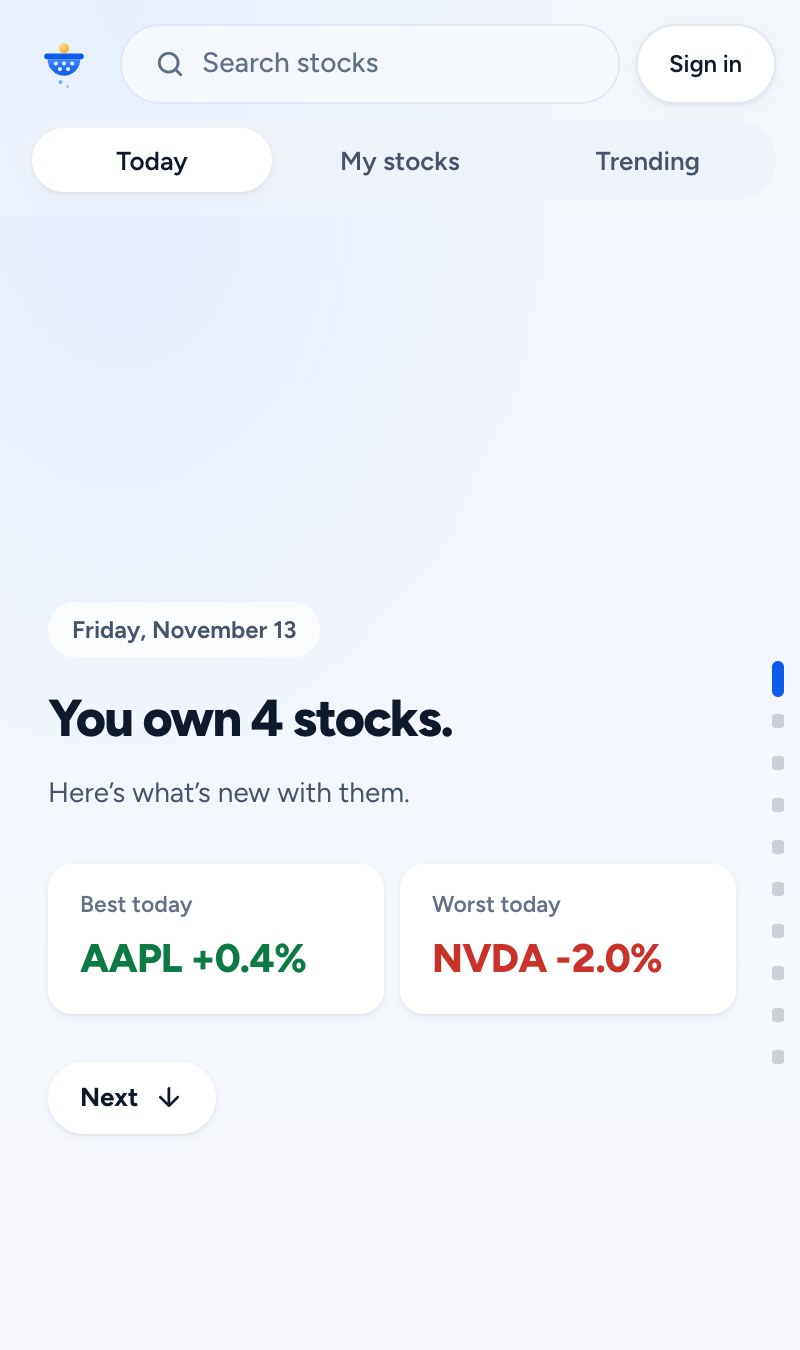
Most people don't want to read a full page about their stocks. They want to open the app, get the gist, and get on with their day. So I rebuilt the dashboard around a daily recap that works like Instagram Reels. You scroll through it one card at a time, and each card covers one thing, like what the market did today or why one of your stocks moved.
The recap opens by itself the first time you visit each trading day, and once you close it, it doesn't come back until tomorrow. A fast flick only moves one card, so you can't skip past something about your own money by accident. Unlike Reels, it doesn't move on by itself, since everyone reads at a different speed.
## what-it-does-now
What it does now
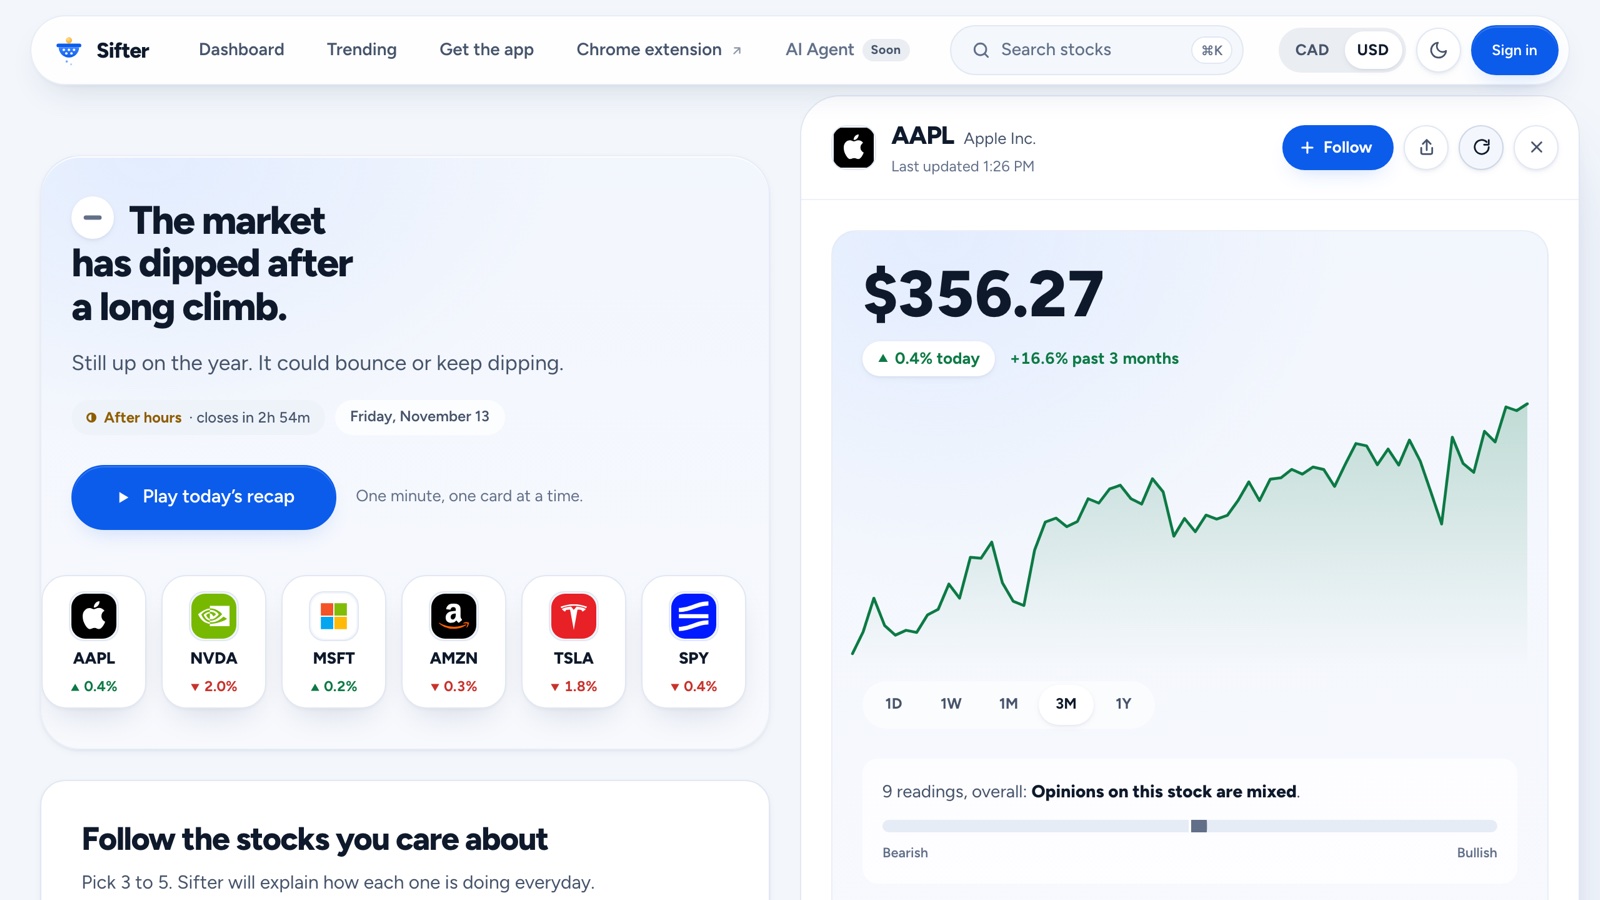
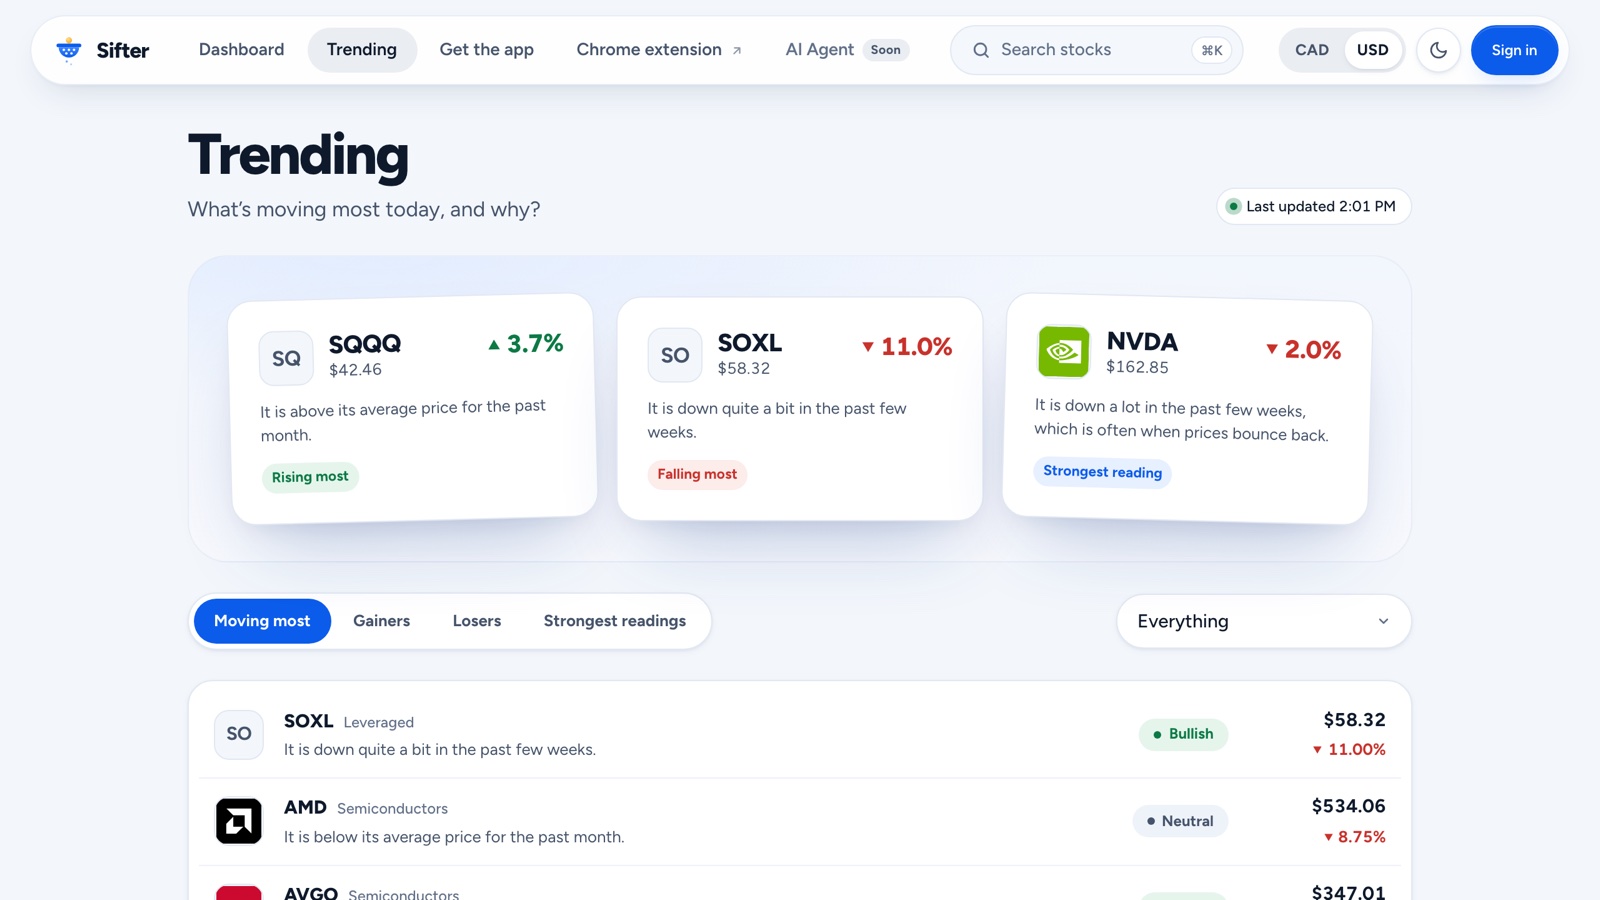
You get a short recap of what changed in the stocks you follow, a watchlist, what's moving today, and a plain-English version of every number on the screen. For example, a P/E ratio of 20 becomes "you're paying $20 for every $1 the company earns in a year."
## technical-challenges
Technical challenges
Sifter gets its prices from Yahoo Finance, which is free but limits how often you can call it. If every visitor made their own calls, a few people opening stocks at the same time could get us blocked, and the cost would grow with every new user.
So nothing is calculated when you open a page. One scheduled Cloud Function checks the market every 2 minutes while it's open, every 15 minutes before and after hours, and not at all when it's closed. It saves the results, and every page just reads the latest saved copy and shows how old it is. Whether 1 person or 1,000 people open a stock, it's the same number of calls, so pages load fast and the cost doesn't change.
Each check covers 60 of the 180 stocks Sifter tracks. It always includes the big market funds, anything someone owns or follows, and anything with a strong signal, then rotates through the rest so every stock gets covered in about a week.
Charts had the same problem. Minute-by-minute prices are a lot of data, so every chart starts on 3 months of daily prices, which the scheduled job already has saved. The 1 day and 1 week charts only load when you tap them, and those are saved for a few minutes per stock too. A hundred people opening the same chart cost one request instead of a hundred.
## the-chrome-extension
The Chrome extension
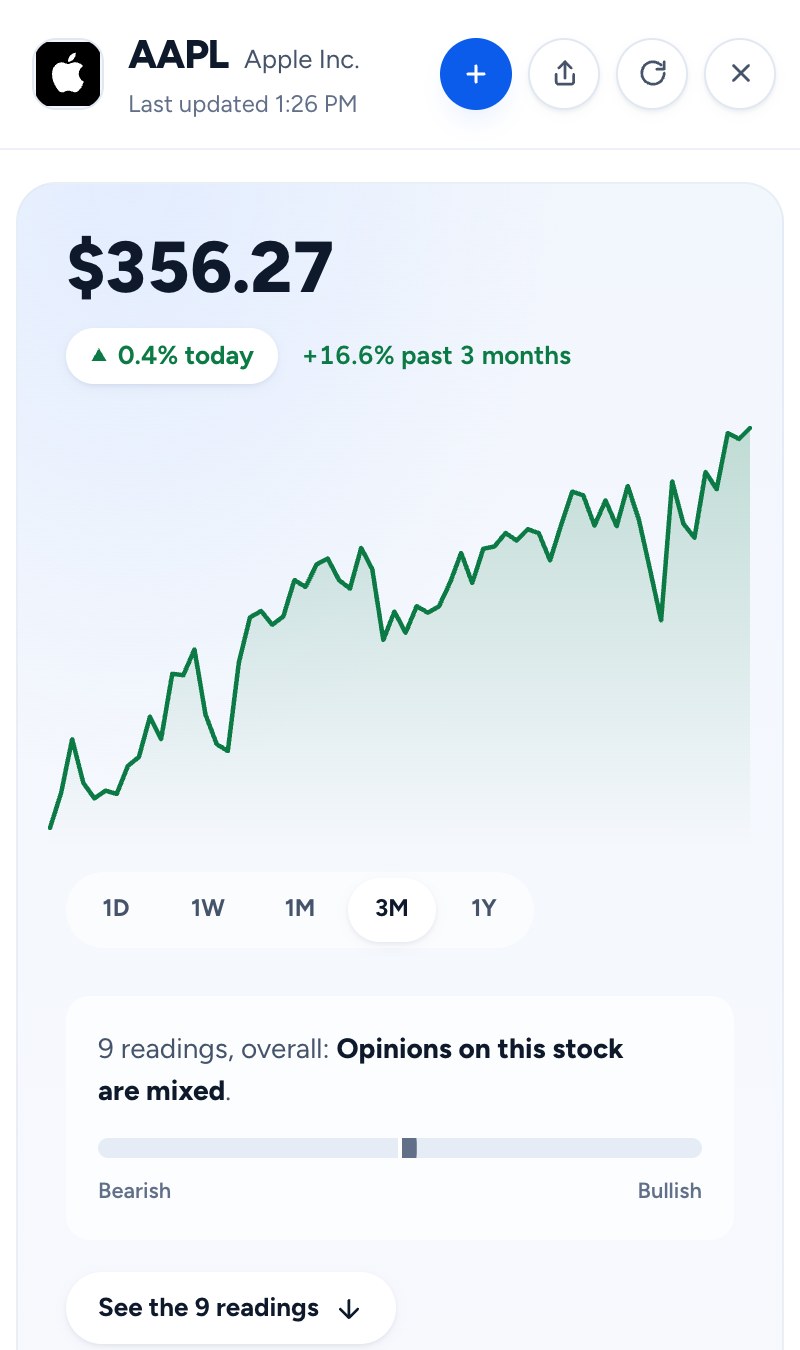
I also built a Chrome extension, so you can check your stocks from a side panel on any website without opening a new tab.
## key-learnings
What I learned
- 01
Building is the easy part now. With AI, anyone can build an app. Knowing what makes a product good, and getting it in front of people, is the hard part.
- 02
Simple is better. I wanted too many features, and it made the app overwhelming. In the end, I focused on the recap and made that one thing really good.
- 03
Think about scale early. If I were the only user, Sifter would be free to run and fast. The real work was keeping it cheap and fast with a lot of people using it at once.
## built-with
Frontend
- React
- Vite
- Chrome Extension
Backend
- Python
- FastAPI
- Cloud Functions
Data & services
- Firebase Auth
- Firestore
- yfinance
- SnapTrade
## next-project
plus1
Your plus one for meetings that matter
read the write-up