~/project/climate.md
Climate Change, Visualized
Climate change, in 3D
- Timeline
- October - December 2025
- Type
- Side-Project
## overview
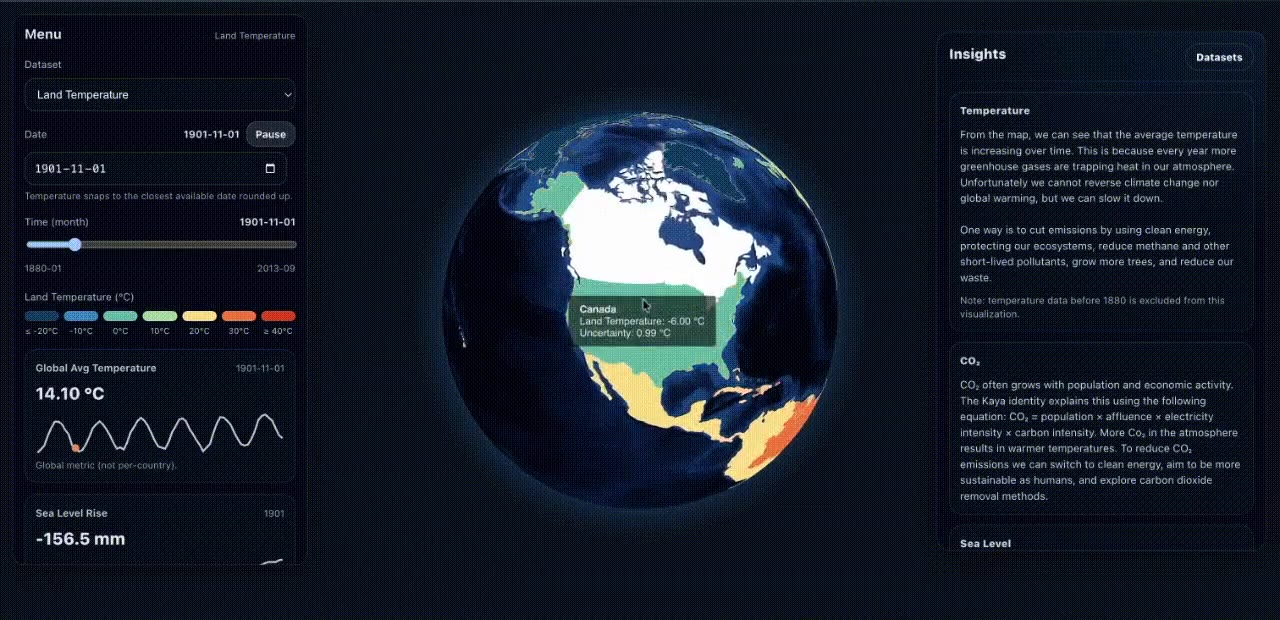
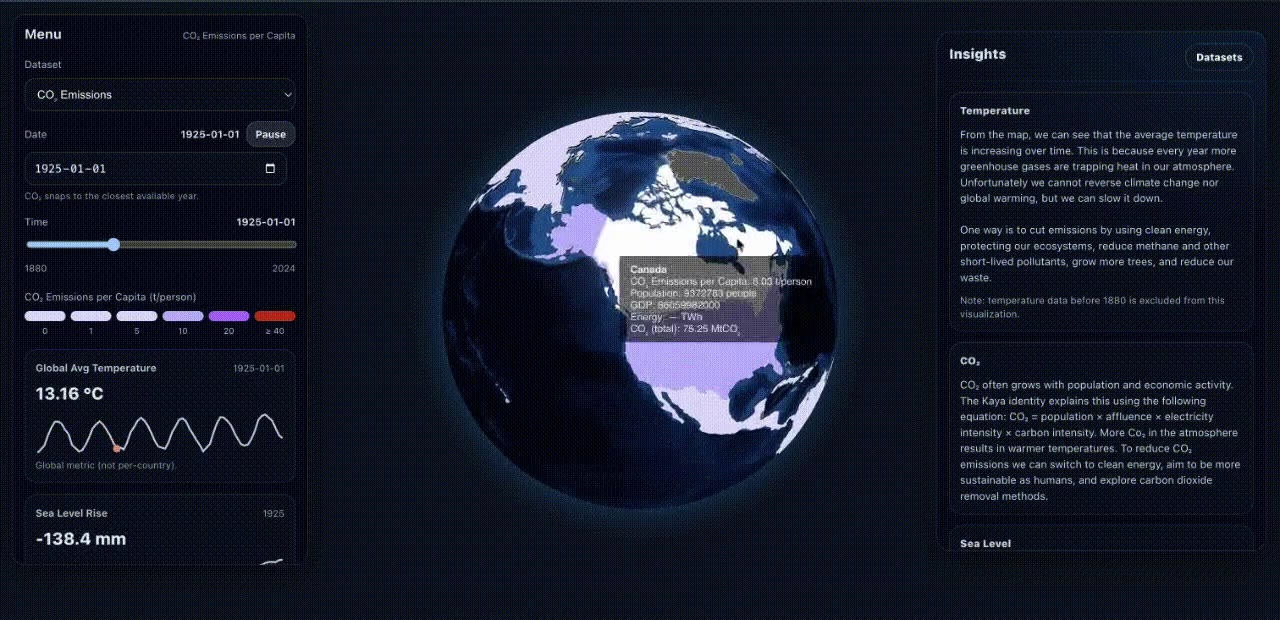
A 3D globe you can spin and move through time. Pick a dataset, drag the slider, and watch each country change colour month by month as land temperatures, CO₂ emissions, and sea levels change. You can also hit play and watch the whole thing animate.
## why-i-built-it
Why I built it
Everyone has seen a climate change chart. A line goes up, people nod, and then they forget about it. I wanted to see what it would feel like to put the numbers back on the planet, where you can find your own country and watch it change.
## what-it-does
What it does
It uses three public datasets: Berkeley Earth's land temperatures by country, Our World in Data's CO₂ emissions, and a global sea level dataset. A side panel shows the global numbers while you explore, like the average temperature for that month and how much sea levels have risen.
## 577-000-rows-in-the-browser
577,000 rows in the browser
The site has no backend. It's hosted on GitHub Pages, so everything happens in your browser. The temperature file alone is 22 MB and about 577,000 rows, one for every country and every month going back to the 1700s, plus 14 MB of CO₂ data.
I read each file once when the page loads and keep only the columns the globe needs. I also cut everything before 1880. Those early records only cover a few countries and come with huge uncertainty, so they made the map look emptier and less accurate, and they were a lot of extra rows to load.
It's still not as fast as it could be. Every time you move the slider, the app goes through all the rows to find that month. If I did it again, I'd group the rows by month once when the page loads, so each slider move is a single lookup.
## getting-countries-to-show-up
Getting countries to show up
The hardest part wasn't the 3D. It was country names. The temperature dataset says "United States" but the map says "United States of America." One says "Burma" and the other says "Myanmar." Every mismatch meant a country stayed grey with no data. I wrote a table for each dataset that matches its country names to the ones the map uses.
The CO₂ data had the opposite problem. It also has rows for regions like "World," "Africa," and "Europe (excl. EU-27)," and some of those were being drawn over real countries. So I added a list of regions to skip. None of this is exciting code, but without it the map only looked finished.
## adding-context
Adding context
Once the globe worked, I kept thinking about the next question someone would have, which is "okay, so what can we do about it?" So I added an insights panel that explains what you're looking at, what drives emissions (population, wealth, energy use, and how clean that energy is), and what helps slow it down. On mobile, the menu and insights hide behind buttons so the globe gets the whole screen.
## what-s-next
What's next
Sea level is still just a number in the side panel. I'd like to show it on the oceans too. I'd also clean the data ahead of time, so the page loads a small file instead of the full datasets.
## key-learnings
What I learned
- 01
Most of data visualization is cleaning data. The pretty part is maybe the last 20%.
- 02
Bad data doesn't throw errors. It just leaves a country grey or paints the wrong colour, so you have to go looking for it.
- 03
A visualization keeps people around when it answers the next question they have.
## built-with
Frontend
- React
- Vite
- Tailwind CSS
3D & maps
- react-globe.gl
- Three.js
- TopoJSON
Data
- Berkeley Earth
- Our World in Data
- Sea level rise (Kaggle)
## next-project
nwPlus.io
The club behind Western Canada's largest hackathons
read the write-up